Microbenchmarks: how that speedy library may just break your heart
... and why every data scientist should check out ❤️ Ray
David Eger, August 13, 2021
I do a good bit of data analysis in Jupyter notebooks with Pandas.
The plotting and easy data analysis enabled by IPython and its extensive set
of libraries (pandas, numpy, sklearn, pytorch, keras, tensorflow...)
have made Jupyter Notebooks the de facto environment for the ML world in 2021,
used by everyone from the ML training grounds of Kaggle
and fast.ai to the cutting edge Research teams at
DeepMind,
Facebook Research.
That said, scaling up from exploratory data analysis to production
deployment often involves rewriting chunks of code you built on
sklearn or pandas with more efficient versions of the
same, something software engineers often do in C++. The type flexibility that Python
and pandas provide in exploring your datasets and writing snippets of code comes at a cost:
all values in Python are boxed,
so every expression you execute does type checking and pointer chasing under the hood.
As you might imagine, developing data science insights on an interactive platform only to rewrite them on a completely separate stack has its disadvantages.
Python Trends: becoming the fastest on the planet, at least for pure numerics
To take advantage of the flexibility and interactivity of Python,
developers have wired up performant low-level C libraries like numpy
to minimize the amount of computation your Python interpreter actually performs.
Python objects still orchestrates things, but they're lightweight handles to
efficiently packed vectors of uniformly typed machine words. Much of the actual
compute is offloaded to natively compiled routines.
Taking it another step, Google's Brain and DeepMind teams have now connected the Python runtime directly to the LLVM compiler and built it an optimizing linear algebra library (XLA) that produces much faster code than the naive C++ codes you might have written. A lot of research has been done on making matrix math go fast, and using XLA means your matmuls get shoved through a systolic array if you've got one, multiply-and-adds get "fused" to take advantage of your hardware's native abilities, and your numerics get sliced into chunks sized just so to optimize the usage of your accelerator's cache hierarchy.
Even more recently, Google's JAX team took Mike Innes's audacious 2017 challenge:
Can we build systems that treat numerics, derivatives and parallelism as first-class features, without sacrificing traditional programming ideas and wisdom? -Mike Innes
and answered it with an affirmative for Python. With JAX
you now have Automatic
Differentiation, just like you do in
tensorflow and your code can look just like mathematics. Jax's promise is:
write your function as you normally would in numpy, and when you need to take
a derivative (as you do when implementing gradient descent)
just pass your code to jax.grad() and get the derivative "for free,"
even if your code has loops, branches, or calls to np.sin().
Added together, these improvements have boosted Python — poor, slow, Python, the whipping boy that's 60,000 times slower than optimized C++ run on a CPU — to set world records for the fastest code on the planet at the 2020 MLPerf competition.
Jumping onto the Bandwagon
All of this sounds splendid!
Native Python code is slow, but using specialized libraries make it even faster than C++.
Hearing all of this made me wonderfully optimistic, especially after running a couple of microbenchmarks to verify that some of my inner loops were 2x faster using some fancy new libraries. The 💔 part came when I tried to actually convert my code and got 2x slower results.
But why didn't you just...? If you think this to yourself below, you're right. Gold star. There is a better way to do all of the below. The point of these examples is to show how easy it is to go off the rails when swapping in usage of a fast new library.
Microbenchmark #1: jax.jit
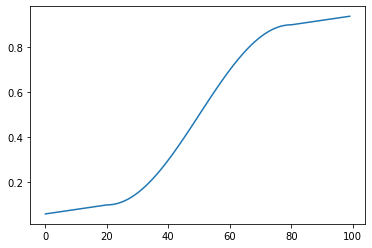
As in many applications, I often have some sort of piecewise function to evaluate
in my innermost loop. Here's a relatively simple one I might evaluate, mapping
inputs 0.0 - 100.0 to 0.0 - 1.0 with a nice curve:
import numpy as np
import math

breaks = [20, 80]
f1   = lambda x: 0.1 - (breaks[0] - x) * 0.002
f2   = lambda x: 0.5 - 0.4 * np.cos((x - 20.) * math.pi / 60.)
f3   = lambda x: 0.9 + (x - breaks[1]) * 0.002
pw_fns   = [f1,  f2, f3]

def fn(x):
  index = np.searchsorted(np.array(breaks), x)
  return pw_fns[index](x)
Translating this into jax with the helpful
tip
of JAX team member Jake VanderPlas is straight forward:
import jax
import jax.numpy as jnp

f2j  = lambda x: 0.5 - 0.4 * jnp.cos((x - 20.) * math.pi / 60.)
pwj_fns  = [f1, f2j, f3]

@jax.jit
def fn_jit(x):
  bounds = jnp.array(breaks)
  index = jnp.searchsorted(bounds, x)
  return lax.switch(index, pwj_fns, x)
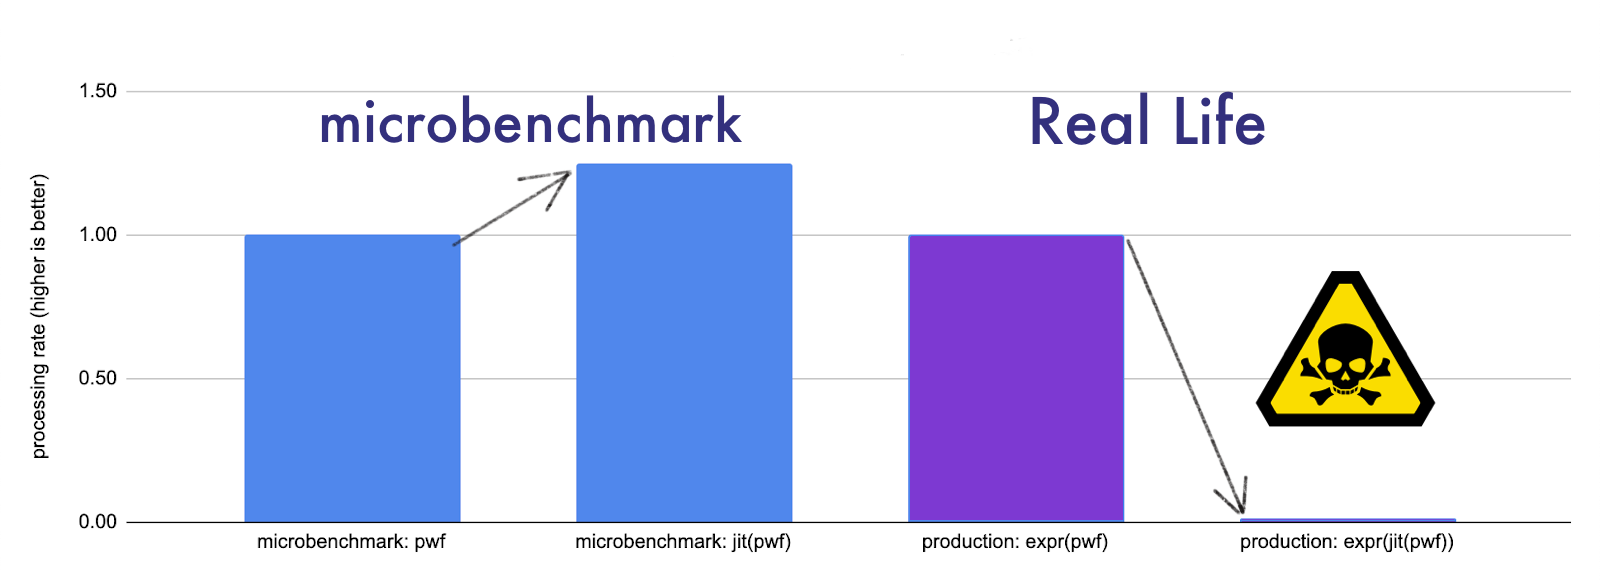
On the Xeon(R) Platinum 8173M I hosted my notebook on (the CPU
you're on will greatly affect your results) evaluating these
functions on 5000 inputs show the jax-ified fn_jit to
be 20% faster than the equivalent numpy fn, and if you use
jax's handy vectorization vmap, evaluating the function 5000
times was 20 times as fast!
def reify(xs):
  # Make sure that all of the values in the list xs have actually
  # been computed down to float values.  Otherwise jax may have
  # just "started" the computation asynchronously, haha!
  #  https://jax.readthedocs.io/en/latest/faq.html#benchmarking-jax-code
  return [float(x) for x in xs]

rand_vecs = np.random.rand(5000, 3) * 100.
%%timeit
_ = reify([fn(s) for s in rand_vecs[:, 0]])
10 loops, best of 5: 50 ms per loop
%%timeit
_ = reify([fn_jit(s) for s in rand_vecs[:, 0]])
10 loops, best of 5: 40 ms per loop
%%timeit
_ = reify(jax.vmap(fn_jit)(rand_vecs[:, 0]))
1000 loops, best of 5: 2.54 ms per loop
This looks great! Now while I'm not ready to rewrite my whole stack of code in pure
jax, even that 20% speed up could save me minutes on a long running routine, so how about
starting by just swapping in fn_jit for fn? The piecewise function evaluation was
not the whole of the code in my inner loop, just the hottest section, and was called
from code like this:
def my_exp(p, q, r):
  return p * q / (1.0 + r)

def full_code(v):
  return my_exp(fn(v[0]), v[1], v[2])

%timeit _ = reify([full_code(rand_vecs[i]) for i in range(rand_vecs.shape[0])])
10 loops, best of 5: 53 ms per loop
According to the microbenchmark, I should get a nice speed up...
def full_code_jit(v):
  return my_exp(fn_jit(v[0]), v[1], v[2])

%timeit _ = reify([full_code_jit(rand_vecs[i]) for i in range(rand_vecs.shape[0])])
1 loops, best of 5: 3.2 s per loop
But instead I get a 60x slow down (at least in jax as of 0.2.18 / August 9, 2021)!
So what happened? Why did we land in this heartbreak of disappointment?
While the jit'd version of our piecewise function on its own is faster, the type it
returns is not a Python float, it's a
type(fn_jit(5)) == tensorflow.compiler.xla.python.xla_extension.DeviceArray.
This specialized type is optimized for being stored and computed on a device that does all the numeric
computation (GPU, TPU, AVX registers) and usually is not manipulated by the Python interpreter at all.
If you naively use this type in Python expressions, every time Python executes an operation
it has to think about how to unbox the value from this specialized xla
container and find the right function to compute a multiply or add
of this thing against a native float.
Remember, native Python is slow. So even though you can "just write numpy
like you used to" and "get much faster results through the magic of jax and xla,"
you'll only get the full benefit of those lightning-fast speedups if your code
is pure numeric and fully rewritten to jax so it can all run on your accelerator.
That said, all is not necessarily lost. Now that we know what's going on,
we can get some of the speed up we saw in our microbenchmark, we just have
to be very careful to coerce results from our jit'd function back
to "Python native" floats when we're coming out of jax land:
def full_code_jit_cast(v):
  return my_exp(float(fn_jit(v[0])), v[1], v[2])

%timeit _ = reify([full_code_jit_cast(rand_vecs[i]) for i in range(rand_vecs.shape[0])])
10 loops, best of 5: 50 ms per loop
A 5% speed up: not bad.
Again, if this is our entire routine and we're willing to go all the way
to vmap this routine, we could do much better:
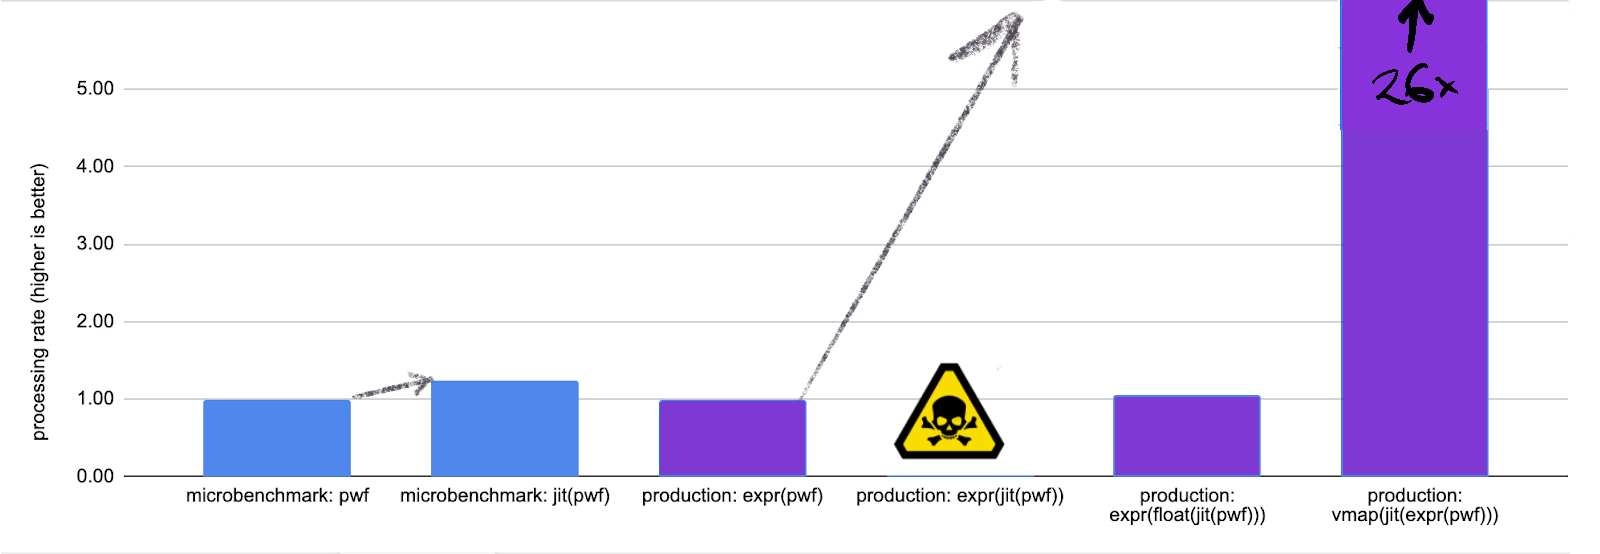
Takeaway: jax is best used when you're converting a large numeric
computation, preferably most of your program, into a giant numeric subroutine.
It can be used piecemeal, but if you're doing so, be careful to coerce your
types to python native floats or numpy arrays when switching back to
native Python land.
Microbenchmark #2: Polars dataframes
In 2021 we've reached the End of Moore's law. Our chips are not getting faster, branches are disastrous, and in typical code our cores spend most of their time idle waiting on memory.
Pandas queries are database-like operations and can be greatly accelerated in this new world by vectorizing their execution. This both minimizes branches and effectively utilizes processor caches and execution units by operating column-wise over your data. Ritchie Vink ran with this idea and in 2020 implemented a Pandas replacement called Polars which benchmarks 5-10x faster than pandas for large dataframes.
Since much of my development is in Pandas, getting a 5-10x speed up sounds great!
So let's take an application: summarizing reviews for restaurant listings. The input data for each listing is a table of review data like the following:
| stars | reviewer_id | review_age_weeks | primary_topic | for_business | text_length | text_quality | language |
|---|---|---|---|---|---|---|---|
| 3 | 3172 | 10 | "atmosphere" | false | 115 | 0.97 | "es" |
| 3 | 8100 | 23 | "food" | false | 46 | 0.86 | "en" |
| 5 | 7470 | 45 | "food" | true | 58 | 0.91 | "en" |
| 3 | 8664 | 19 | "location" | false | 43 | 0.95 | "en" |
| 2 | 8243 | 11 | "location" | false | 251 | 1 | "en" |
| 1 | 6626 | 28 | "location" | false | 181 | 1 | "en" |
We'll have two goals for our summarization benchmark:
a. Select a few diverse reviews to show on the first page (which will be the basis of our "microbenchmark" comparing pandas to polars)
b. Calculate this restaurant's rank vs all other restaurants for each rating aspect: "atmosphere", "food", "speed", "location", and "friendliness."
Since we want to show what's both good and bad about the restaurant, we choose a few reviews from each star rating bucket to show. In pandas, we use the following code to choose which reviews to show:
def pd_get_representative_reviews(df, depth=2):
  return df[df.language == 'en'].sort_values(
      by=['stars', 'review_age_weeks']).groupby('stars').head(depth)
In polars, the equivalent code is similar:
def pl_get_representative_reviews(df, depth=2):
  return df[df.language == 'en'].sort(
      ['stars', 'review_age_weeks']).groupby('stars').head(depth).sort(['stars', 'review_age_weeks'])
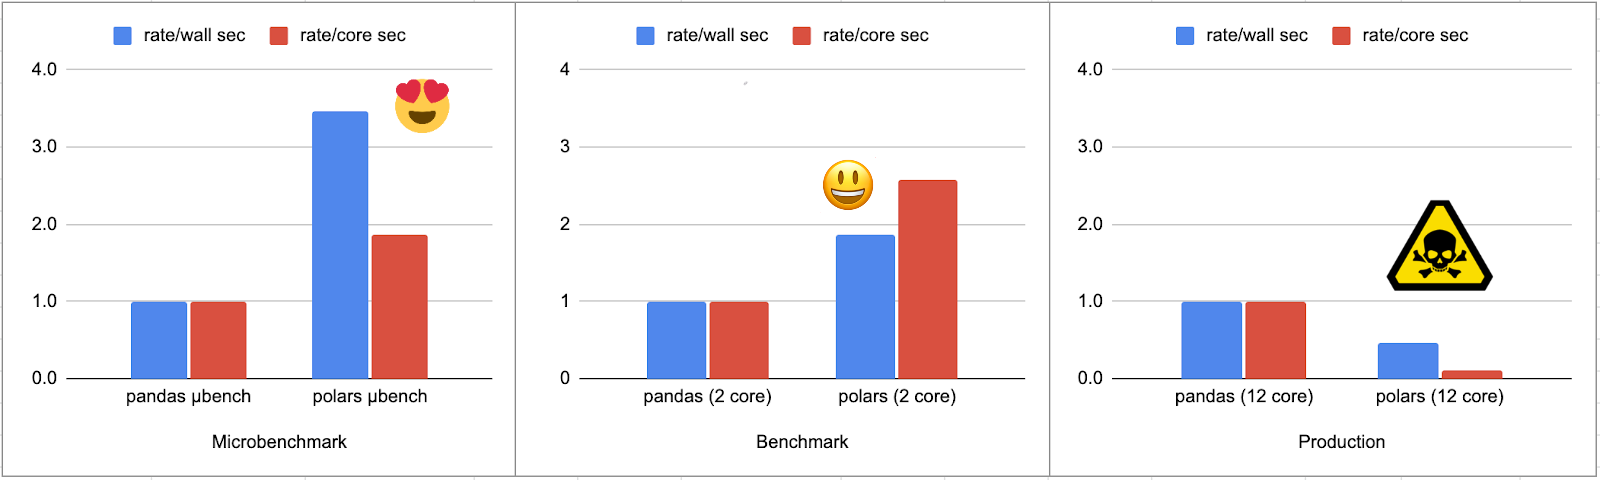
After that, we use identical code for calculating each listing's aspect ranks (we'll go into that later). We benchmark this code on 25,000 dataframes whose review counts follow a Zipfian distribution: a few popular restaurants have thousands of reviews, most listings only have one or two. And we confirm that Polars is a real winner over Pandas running on a free 2-core Google colab instance:
Pandas finding representative reviews for 25000 synthetic listings + no post processing
CPU times: user 2min 49s, sys: 3.35 s, total: 2min 52s
Wall time: 2min 52s

Pandas finding representative reviews for 25000 synthetic listings + rank finding
CPU times: user 4min 12s, sys: 4.19 s, total: 4min 17s
Wall time: 4min 15s

Polars finding representative reviews for 25000 synthetic listings + no post processing
CPU times: user 45.5 s, sys: 21.8 s, total: 1min 7s
Wall time: 49.7 s

Polars finding representative reviews for 25000 synthetic listings + rank finding
CPU times: user 2min 10s, sys: 23.8 s, total: 2min 34s
Wall time: 2min 16s
This is great! We getting about a 2x speed up by both wall time and core time. But something very strange happens when we run the same code on a workstation:
Pandas finding representative reviews for 25000 synthetic listings + no post processing
CPU times: user 1min 39s, sys: 2.41 s, total: 1min 41s
Wall time: 1min 41s

Pandas finding representative reviews for 25000 synthetic listings + rank finding
CPU times: user 2min 24s, sys: 3.29 s, total: 2min 27s
Wall time: 2min 27s

*CPU History: Over 75000 records, computation jumped core at least 33 times.*

Polars finding representative reviews for 25000 synthetic listings + no post processing
CPU times: user 3min 3s, sys: 2min 17s, total: 5min 21s
Wall time: 43.9 s

Polars finding representative reviews for 25000 synthetic listings + rank finding
CPU times: user 13min 17s, sys: 8min 15s, total: 21min 33s
Wall time: 5min 23s

*CPU History: Over 75000 records, computation jumped core at least 48758 times.*
What the what? Running on a different machine now makes our Polars-enhanced Python routine more than twice as slow and uses 8x the core time.
It's not the version of Python or Polars we have installed on the workstation, but rather the game of musical chairs that happens to the Python execution thread each time polars code gets run, combined with the fact that our rank calculation code uses a chunk of memory.
Before the benchmark runs, we calculate for each listing its per-aspect star
rating — one for food, one for atmosphere etc. So for our 25,000
listings and 5 aspects we have a table of 125,000 floats, which pandas
will by default store as float64's. So these aspect ratings add up
to about a megabyte of data. We sort these lists and store them in
np.arrays which we scan during the benchmark using np.searchsorted
to find each listing's aspect rank in the appropriate sorted list.
On my workstation's 12 core Xeon(R) W-2135 CPU @ 3.70GHz each time Python wakes up from a multi-core Polars frenzy, it lands somewhat arbitrarily on a different core (see the core jump counts above). Waking up on a new core, that 1 megabyte of reference data? It's not in the L1 cache. Heck it's not even in the TLB! Since most of what this code is doing is scanning this megabyte of data, well, it's not hard to see how you could take eight times as long to run the same computation. If you fire up the perf tool you'll see that the "+rank finding" benchmark has a dTLB hit rate of about 94.5% in the pandas version but only about 60% in the polars version.
$ metrics="cycles,cpu-migrations,dTLB-loads,dTLB-load-misses,iTLB-loads,iTLB-load-misses"
$ perf stat -e ${metrics} -I 10000 -B python3 run_synthetic_benchmark.py
...
#           time             counts unit events
   # typical pandas (+reviews) 10 second sample
   140.123674435     46,184,415,159      cycles
   140.123674435                  2      cpu-migrations
   140.123674435        699,766,397      dTLB-loads
   140.123674435         39,190,216      dTLB-load-misses          #    5.60% of all dTLB cache accesses
   140.123674435        238,181,099      iTLB-loads
   140.123674435         11,387,722      iTLB-load-misses          #    4.78% of all iTLB cache accesses
...
   # typical polars (+reviews) 10 second sample
   190.160462649    171,927,950,381      cycles
   190.160462649             11,547      cpu-migrations
   190.160462649      1,022,200,896      dTLB-loads
   190.160462649        408,419,133      dTLB-load-misses          #   39.95% of all dTLB cache accesses
   190.160462649         97,819,619      iTLB-loads
   190.160462649         39,125,067      iTLB-load-misses          #   40.00% of all iTLB cache accesses
Code: Google Colab notebook as Standalone Python
Takeaway: Be very careful mixing "native Python" code with multithreaded libraries like Polars, especially if the library call isn't running long enough to take much advantage of being on multiple cores. Polars is amazingly performant for expensive queries over large dataframes, but without careful coding you may end up thrashing your cache hit rate for your Python Interpreter thread.
An alternative for the impatient: Ray ❤
Both jax and polars provide libraries that can massively
speed up numeric Python code when you're working on really
big data and you go all in with them. However, both libraries
require some code rewrite and have some surprising foot-guns
especially for data sets that aren't huge.
Is there a better way to get speed up your data science?
There is, and that way is Ray.
While Ray will not jit or xla your code into a massively more
performant version, what it does is provide an exceptionally
easy way to run the Python code you have today — however efficient
or inefficient it is — in parallel: across all of the cores
of your laptop or cpus in your datacenter.
If you have a pure Python function f(x) all you have to do
is wrap it with a @ray.remote annotation to prepare it to execute
on a remote core or machine and call .get() to fetch the computed
value:
def ray_pmap(f, xs):
  """Equivalent to list(map(x, xs)) but done in parallel!"""
  @ray.remote
  def g(x):
    return f(x)
   return ray.get([g.remote(x) for x in xs])
Using ray_pmap with our original pandas code on our 12 core xeon
means the expensive cost of loading that 1MB of reference data into
each core's cache happens in parallel, approximately once
for each core. It's still expensive to do (as in our Polars version)
and we'd still do well to make that code more efficient, but with
relatively little change, we get more than 2x speed up, basically
for free:
Pandas finding representative reviews for 25000 synthetic listings + rank finding
CPU times: user 2min 24s, sys: 3.29 s, total: 2min 27s
Wall time: 2min 27s

Pandas (ray) finding representative reviews for 25000 synthetic listings + rank finding
CPU times: user 1min 3s, sys: 8.09 s, total: 1min 11s
Wall time: 1min 1s
The reason our speedup is not greater than ~2x is due to our Zipf ditribution; there's one extremely large listing with over 100,000 reviews that takes as much time as most of the other listings combined. Otherwise, our speedup would scale almost linearly with core count (up to the limit of Amdahl's law ).
And if you do have fancy Python codes that take advantage of xla and TPUs,
you can still use Ray to orchestrate your computation.
That's how kingoflolz and
@theshawwn of Eleuther.AI
train their GPT models on TPUs
Happy coding, y'all, and try not to get your heart broken out there by the siren songs of microbenchmarks.
Notes
But why didn't you just...?
But why don't you just jax.vmap(jax.jit()) the whole routine?
Yes, that is the right thing to do for speed.
But sometimes converting your whole program to jax isn't so easy.
If you're still developing a new function and have
debug prints in your routine you cannot jax.jit() it.
If you call other libraries (like pandas) which are not
pure-numeric, you also can't just jax.jit() it.
But why don't you write your routine to process batches instead of a single example?
Writing your functions to work on batches of data can yield amazing speedups, and it's the core idea behind modern database engines like CockroachDB and Polars being vectorized.
However, there's a reason why jax team developed vmap:
writing code to process a single example instead of a batch
often feels more natural. You can test your routine on a single
example easily, and it's not possible to "accidentally" use all
of the batch's data when you don't intend to.
For restaurant listings, suppose atmosphere is a seasonal
phenomenon for restaurants near parks and you want to
highlight restaurants especially good to visit in April (when
their atmosphere rates 1.3x normal).
If in coding a batched version of your function you "forget"
to generate your yearly average only for the
restaurant in question, you might instead end up simply
highlighting all restaurants whose atmosphere generally
rates well against the average restaurant rating all year long.
But why didn't you just make your aspect ranker more (memory) efficient?
In our example there end up not being that many values for aspect ratings, so instead of storing all of them, you can radix sort the rating values. This will drop memory requirements from ~1 Megabyte to about 12 Kilobytes, and hopping from core to core will be much faster. But our point is a meta-point about how easily you can accidentally slow yourself down in our new multi-core world. On the single or dual core VM, we never had to think about the cost of having 1MB of pre-computed reference data — using it was pretty fast. When we went multicore with Polars, our computation's memory intensive sections were a heavy cost every time we hopped to a new core. Ray doesn't eliminate that cost entirely, but it sure softens the blow and lets us spend more time exploring our data, faster, and less time obsessing about how we might optimize our current algorithm, or accidentally get burned trying to do so!
What do your Reviews Dataframes look like, really?
You can run the code yourself 😃
Download it from here and run python3 <run_synthetic_benchmark.py
When I ran it I saw:
15257 listings with > 0 and <= 2 reviews
4297 listings with > 2 and <= 10 reviews
1287 listings with > 10 and <= 100 reviews
143 listings with > 100 and <= 1000 reviews
10 listings with > 1000 and <= 10000 reviews
1 listings with > 10000 and <= 100000 reviews
Acknowledgements
This post included valuable feedback from Jake Vander Plass, Will Bradbury and Ritchie Vink. Any remaining errors are entirely my own.
Like data science?
Consider a career at Google (my employer) or Anyscale (makers of Ray), two companies that love top notch engineers and data scientists and are always looking for good talent.